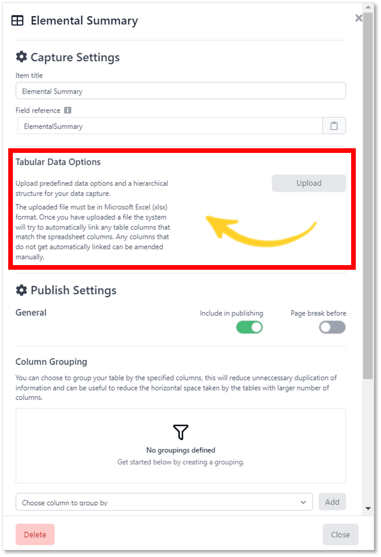
The Tabular Data Options function enables the import of structured data options into the table you have designed in GoReport Creator. Results of the imports present a hierarchy of data options for the surveyor or inspector when completing a data capture.
This is particularly advantageous when there is a significant range of assets, with multiple options against each of those elements. The hierarchy ensures that after selecting the first-tier data option, the subsequent tiers are only the options that the user would expect to see for that type of asset.
The feature is accessible once you have created a table in GoReport Creator. However, the import of the Tabular Data options should only happen once you have finalised the structure of your table and aligned it with the spreadsheet columns that you will be uploading.
Note: You can import data as many times as you like, however, the logic will only make sense, if the uploaded file matches the structure of the table you have designed in GoReport Creator.
Tabular Data options allows you to upload predefined values for the table row during data capture, see below:
Example:
The best way to describe the use of Tabular Data Options is through an example. The following example is a small sample set of a much larger set of options you might encounter in a schedule of condition type survey to illustrate the principles of using the Tabular Data Options upload.
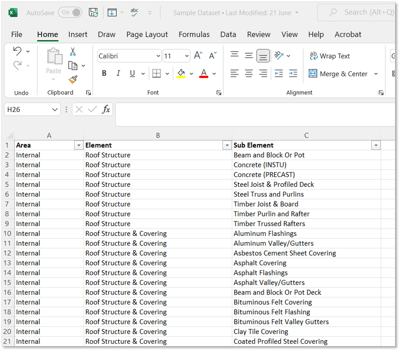
The table I have designed has 3 columns. Area, Element and Sub-element.
🔗For assistance on creating a table, go to article GoReport Creator How To - Design - Table
For each of these columns, I could enter the options I wish the user to pick from using the fields within the Creator tool. This is appropriate in many instances. However, for the survey in this example, I want to define the options that the user will have for all columns outside of GoReport and then import them in one action.
The dataset I have decided to upload should be structured to match the structure of the table. If the system does not automatically match the columns, there will be an opportunity to manually match.
Note: You need to add a row for each full element option.
The sample dataset below is an example of how the data needs to be structured. For the purposes of illustration, a deliberate error has been included. The third column in the data capture is called “Sub-element” whereas the spreadsheet column is called “Sub element.” For efficiency, you would ensure that the spreadsheet columns are matched identically to the names of the columns in GoReport Creator. However, in this case, we will proceed and resolve at the mapping stage.
We have included a sample set of data for you to download and use as part of this example. 📁Sample Dataset
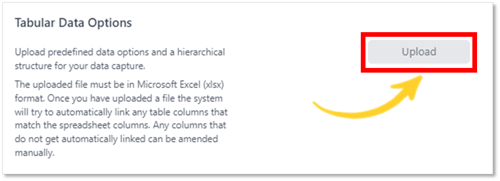
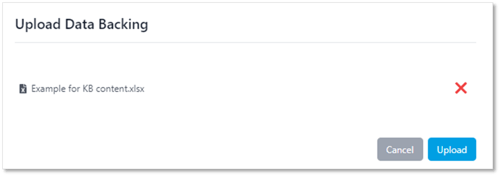
To upload the Tabular Data options, select the upload button and either drag and drop your file or upload from your computer.
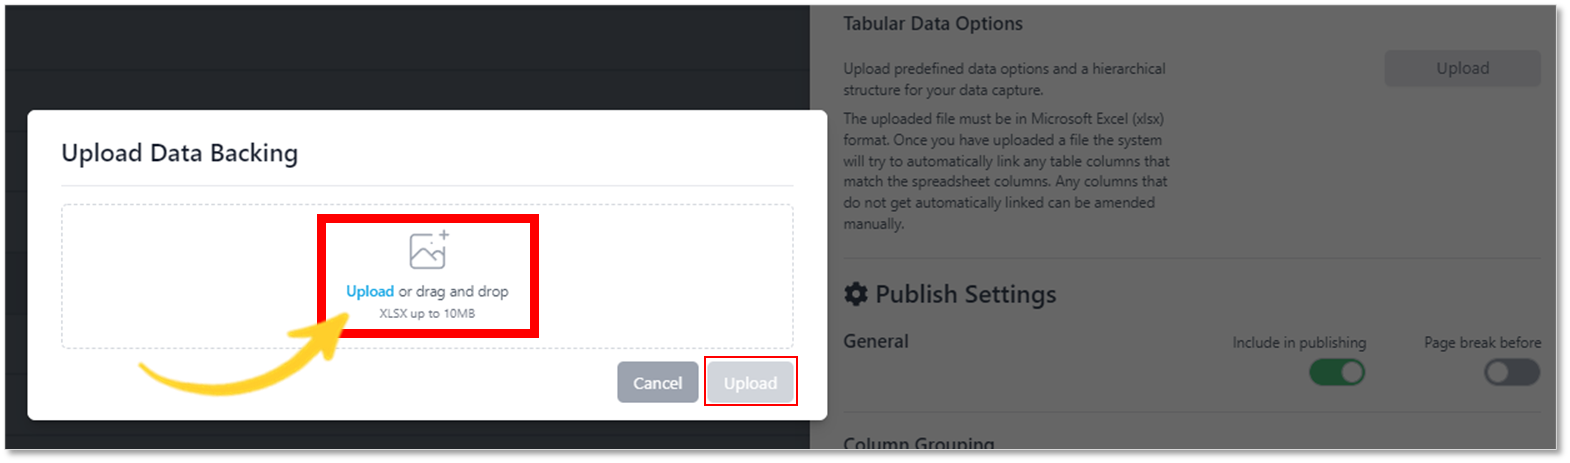
When you have selected a file, you can either remove it by clicking X or click the upload button to upload the data to GoReport Creator.
Once the file has been processed, several new options appear.
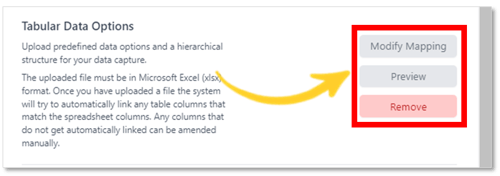
Modify Mapping
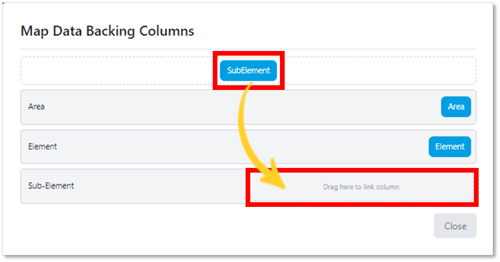
The screenshot below shows that two columns have automatically matched while the third, our deliberate mistake, has not yet been matched. To match the column at this stage, drag and drop to the required link.
Note: You have full flexibility to change which spreadsheet column links to which GoReport Creator Column at this point if you wish.
Preview
Preview enables the user to quickly view the contents of the uploaded file without having to open it again.
Remove
Remove will remove the upload file to allow you to start again or move on without uploading Tabular Data Options.
The options you have added will now be “live” in GoReport Creator. You can view how they appear in the iOS app by following the steps of making your data capture live and viewing in the iOS app or GoReport Web Portal.
iOS App Preview
For this Example Data, you will see that on Selecting “External” for the area, only the options for Chimneys (inc. Flashings), Roof Structure & Roof Covering will appear for the Element Column. If I then select Roof Covering, only the options for roof coverings appear. This is an example of a data hierarchy.
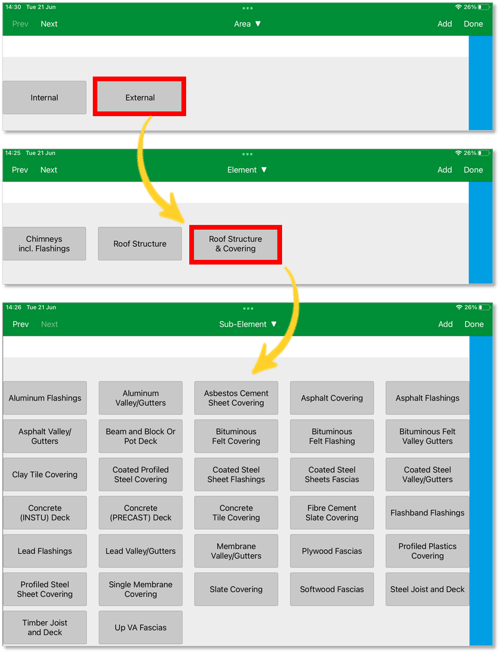
Note: If you do not select an option as you move through the table, by default you will be presented with all subsequent options.
We recommend you test a similar example to try Tabular Data Options and explore further by adding different options and columns.